Senior Experience Machine Learning Section 8 - Decision Tree Regression
Decision Tree Intuition
CART = encapsulates 2 types of trees: Classification Trees, Regression Trees
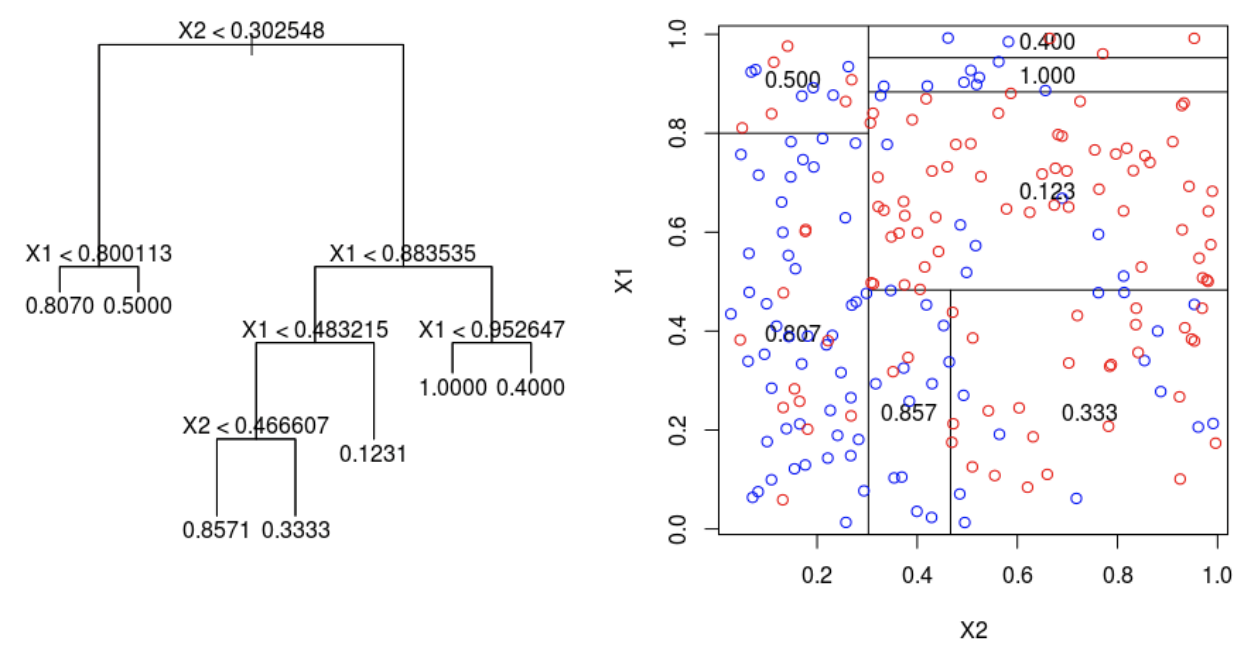
| Ok so a lot of the time if you see a decision tree thing looking like this. (This is an example with 2 independent variables and the machine predicting 1 variable) The diagram will be split! |  |
|---|
 | Splits are determined by asking “does this split of data increase the amount of information we have about these points” and will stop once it cannot add more information from splitting. |
|---|
How is the machine going to predict using a Decision Tree?
Let’s say the next point is x=30 y=30. It’d fall in the middle-bottom area (box), terminal leaf, of that decision tree. In each terminal leaf, the points have an average value.
R-Squared
Evaluates how good regression is going using Sum of Squares.
R^2=1-(SS/TSS)
(used in regression) Sum of Squares → Y1 - Y(predicted line)
Total Sum of Squares → Y1 - Y(average)
